


Congratulations. You've managed your lake or pond. It has happy water, the habitat is optimized, and the fish seem to be doing well, and now you're done.
Right?
Maybe. Like any natural system, it's under constant pressure to change, fill niches, and respond to environmental changes. So how does the pondmeister determine how to keep things happy?
With data and the tools that help digest the data.
Together, they can provide hints as to what's going on and help you manage your fishery.
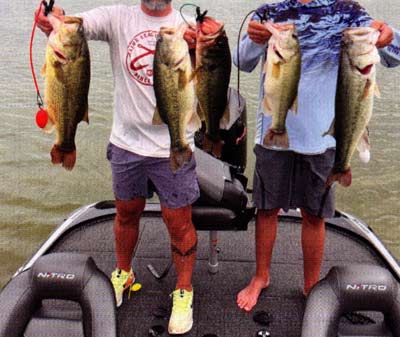
With apologies to the headless fishermen (who want to remain anonymous), which of these fish are healthy? From left to right they measure (total Length, decimal weight):
22 inches, 5.55 lbs.
21 inches, 4.54 lbs. 20 inches, 4.12 lbs. 17 inches, 2.88 lbs.
22 inches, 4.45 lbs.
Feel free to check off the fish you think are healthy. There will be a test.
Back in the late 1970s, Dr. Richard Anderson developed "Relative Weight" (Wr). Yes, for you old-timers, that's the same Dr. Richard Anderson who spoke at the Pond Boss I and was a special guest of honor at Pond Boss VI.1 Fishery biologists have used quite a few different condition factors over the years. The most commonly used tool these days is relative weight (Wr). Relative weight is simply the ratio of actual weight to the "normal" or "standard weight" of a statistically large sample within a species of the same length.
Obviously, a longer fish should weigh more than a shorter one, but how much more? How much less is an indication of a problem? Thousands of samples over decades have provided a very good standard weight (Ws) reference. Of course, what is "standard" can change a little for each unique pond or lake, but by collecting enough data for your pond or lake, you'll get a good feel for how much variance you can expect.
Today's electronic phones and computers provide a very convenient way to evaluate and save Wr data. Let's look at an ExcelTM tool and what can be inferred from it.
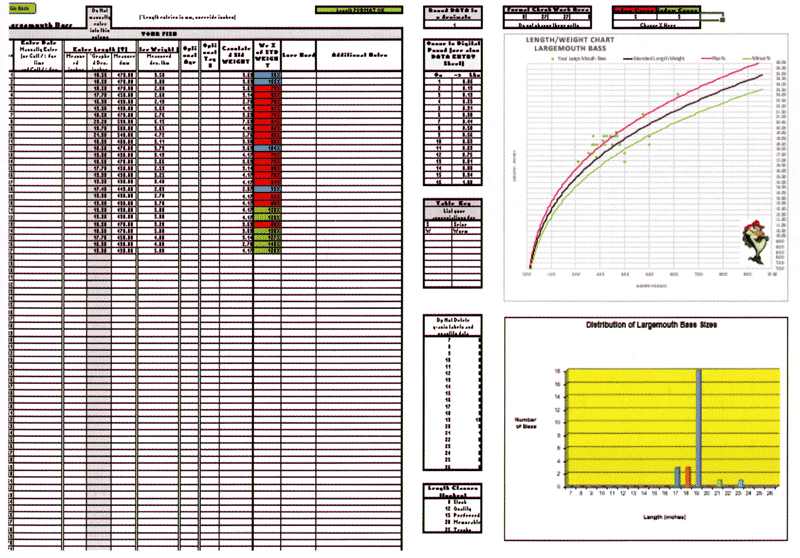
First, don't be intimidated by the apparent complexity of Figure 2. If you get lost in the tool, the first worksheet explains the program and how to use it. Briefly, the area on the left is where you enter your Length and Weight data. The center area are helpful conversion tables and workspace for the program that you can't change. After a quick introduction, we'll spend most of this article on the two graphs to the right.
The data input area supports both Imperial (a.k.a. "English") and metric units. Fishery biologists often use millimeters and grams for their measurements because of increased accuracy and precision, but the inches-pounds tables will work well to help you assess fish in your ponds, and we'll use it in this article. The colored column shows the Wr ranking by entry.
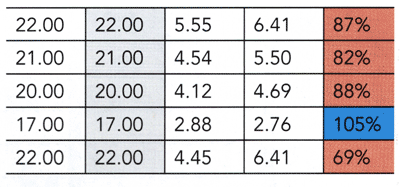
In our opening example, we would enter the Length and Weight data in the white cells and the program calculates Ws and Wr. The color indicates whether Wr is more or less than 100% plus-or-minus the "Window Curve" in the upper-right corner. More about that later.
Plugging our previous numbers into the program answers the first question. By this tool, only the fourth fish is "healthy" (105%). But wait... there's more.
We have observed Wr values ranging from the upper 50%s to the 160%s across a variety of fish species. Fish in the upper 50's are so thin they are barely alive. Those at 140% or above look like plump footballs. Most biologists consider Wr values of 90%-105% acceptable. Please note that a Wr value of 100% is NOT an average. It means that across their range and all seasons, 25% of Largemouth Bass have a Wr value greater than 100%, while 75% are less than 100%. So, a Wr value of 100% is an above-average target, generally speaking.
Sound complicated?
It's really not. That Wr value is simply a goal, that's all. If your fish Wr is 100%, you're in good shape. If it's 90%, that's normal for that season. To help visualize it, the graph includes fields to enter an Upper (red) and Lower (green) "Window Curves". For example, if you enter a "10" in each Window Curve cell, the lines will show 10% above and below the standard curve. This helps you visualize whether your population of fish fall within your Wr goals. The Wr results in the data input area will also change color to match.
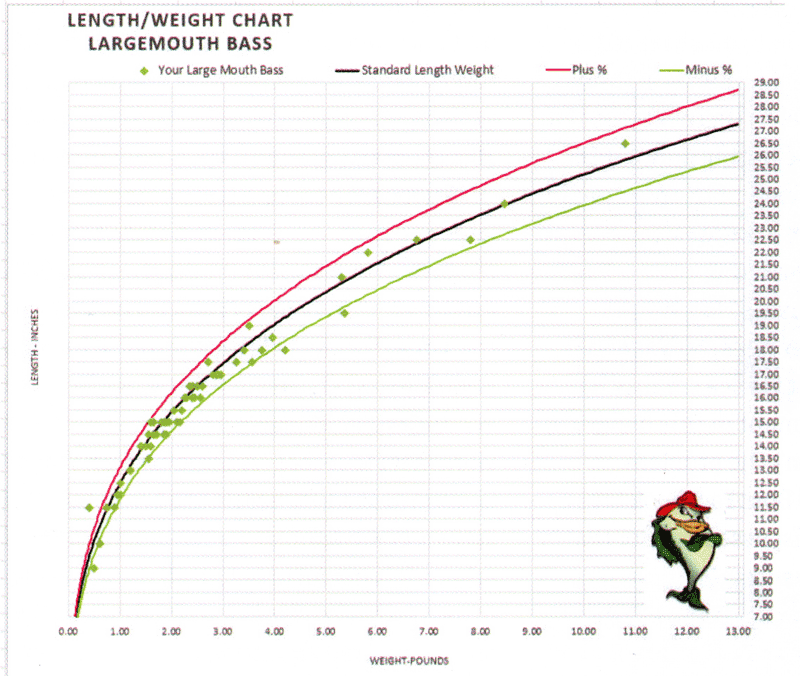
So, let's look at the relative weigh graph for a healthy lake. Again, the Standard curve is the center curve. If a fish sample (green data point) is above the line, it indicates it's lighter than expected for that length. Below the standard curve means it's heavier. In an instant, you can see that the fish samples (the data points) fall mostly between the red and green Window Curves. You may conclude that as far as the LMBass are concerned, this is a happy lake.
Now, let's use our previous five-fish example and add more data.
What we see here is that a large population is "light" compared to its length. This is where your personal experience and records are needed. We know when these data were taken. We also know from the data that four to six weeks ago this population of fish plummeted from the standard curve and started to regain a few weeks later. Considering that 16 to 18-inch Largemouth bass can lay three quarters to one and a half pounds of eggs over a period of a few days, it probably means that four of our example fish were females recovering from a very healthy spawn and are actually regaining their weight nicely over time. It indicates that the smaller fish is a "healthy" male. That means that all the fish in Figure 1 are healthy from a Wr perspective.
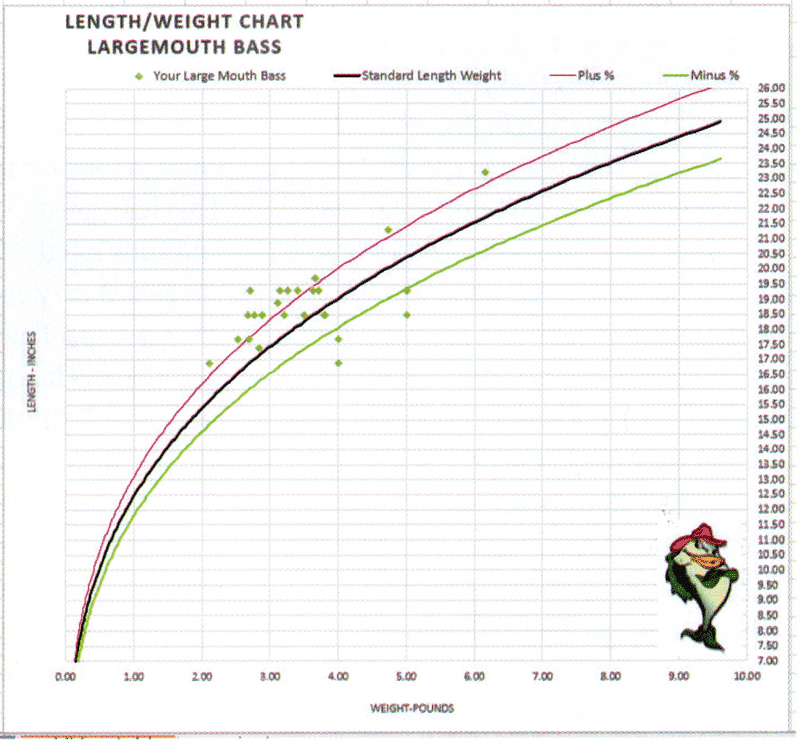
We want to reiterate that interpreting Wr values is not always straightforward. Wr values can vary seasonally, especially as we've shown, before and after spawning seasons. Also, Wr values are a short-term measure of prey abundance. We have observed situations in which a short-term prey supply is abundant, and fish gorge themselves and gain weight. However, if this is the only time of year that food is abundant, the fish may still be thin and slow-growing for the rest of the year. Nevertheless, Wr values are a very important tool in a pond manager's arsenal and keeping data over time will help you understand what it's telling you and can help you ask the right questions.
The chart on the lower right is size distribution. Figure 6 shows in a glance that our "good" lake has a healthy distribution of bass. Chances are, you didn't bother measuring the smaller bass, but this lake has a very good distribution of classes. Note there are a few trophy fish in here as well. The spike at 15 inches could indicate a stocking program is working its way up the chain, or it could mean there are isn't enough food to grow larger. However, the data from the first chart implies there is plenty of food.
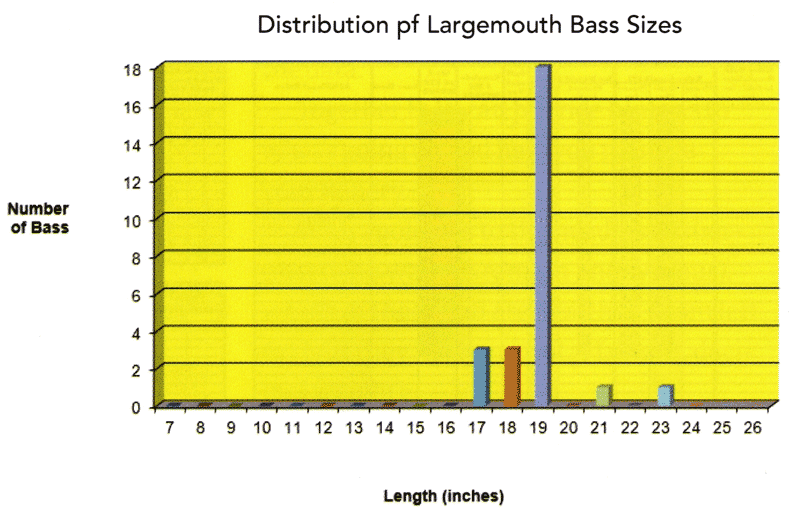
On the other hand, Figure 7 shows what's happening to the "poor" lake. It looks like a single stocking with some over- and underachievers. There is no base for recruitment. This example's Wr curve shows the fish are relatively light-weight (something that you observed in Figure 1 is hard to determine by looking at them one at a time), so there may not be enough food for the existing population. This lake needs a review of the food chain and additional fish of smaller sizes and species. It may call for the culling of many 19-inch bass. This case is rare, and as implied, the manager needs to answer the question, "Why don't we see smaller bass?" Lack of bass recruitment in this fishery is a symptom, not the problem.
In one of the Pond Boss Facebook Live sessions, Bob Lusk discussed a factor not included in this worksheet: Age.
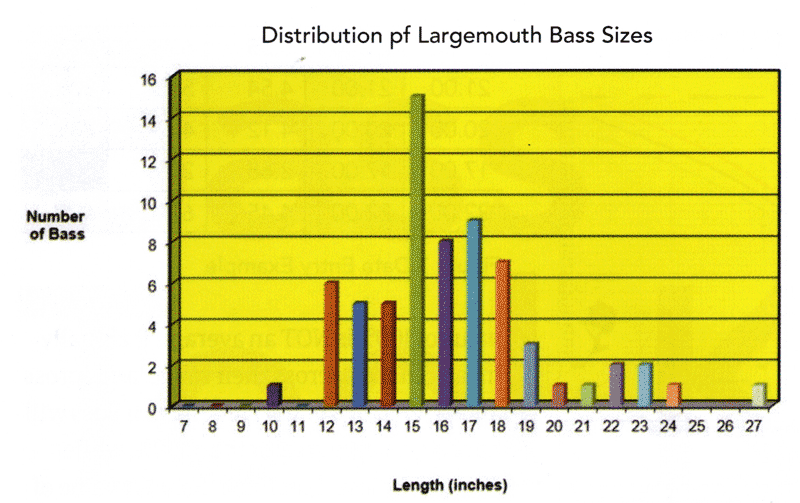
The question is simple: Look at Figure 6. Given the average life span of a Largemouth bass in the USA ranges from 8-14 years (yes, they can also live a lot longer than that), is it better to have a bunch of four-year-old 15- inch bass or a bunch of seven-year-old bass in that class slot?
They all compete for the same-sized food.
The older bass may have been stunted during development for one of several reasons and are unlikely to grow fast enough to become trophy fish in their remaining lifetimes.
If your goal is to raise trophy fish, you may want to remove some of this class and let the younger fish have a better chance to grow.
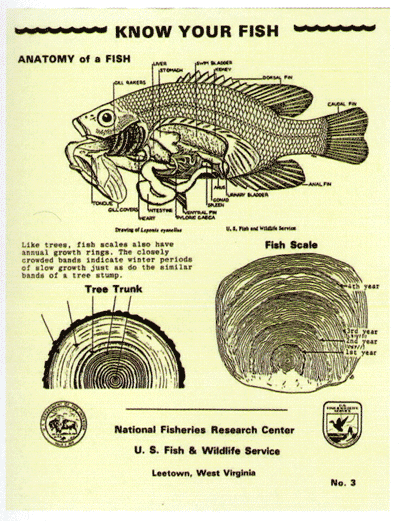
If you decide to age your fish, sample four or five scales on the lateral line near the head. There's a spot on the worksheet to record this information later.
By the way, it turns out that Largemouth Bass, Bluegill, Black Crappie, and White Crappie are all from the same sunfish family, Centrarchidae. They share the same fundamental length/relative weight relationship (i.e., the "standard" curve shape). Just the starting and end points change.
Obviously, a bluegill will never get as large as a Largemouth bass, but the fundamental curve shape on the graph (e.g. as it ages, it gets heavy faster than it gets long) is the same. This fact allows the tool to include separate worksheets for Black Crappie, White Crappie, Bluegill. There is also a worksheet to record "Additional Fish", that is, gizzard shad, threadfin shad, channel catfish, green sunfish, redear sunfish and others. It is useful to record all these species to help answer the previous food chain and species diversity questions.
This tool can help in the management of your ponds and lakes but the most difficult part is the time and effort it takes to collect the data and make use if it. We hope you can see how simple and useful that investment can be, whether it's for a focused survey or collected over days and weeks, even years. For our part, in the interest if continuing education, you can access the tool for free by emailing Pond Boss World Headquarters at info@pondboss.com and tell us you'd like to have the fisheries management spreadsheet. All we ask is that you report any issues or provide suggestions so we can consider improving it.
Suggested Reading:
1) Guy, C.S., and Willis, D.W., 1995, Population Characteristics of Black Crappies in South Dakota waters: A Case for Ecosystem-Specific Management. North American Journal of Fisheries Management 15:754-765.
2) Neumann R. M., Murphy B., Evaluation of the Relative Weight (Wr) Index for Assessment of White Crappie and Black Crappie Populations, Environmental Science, North American Journal of Fisheries Management, 1 November 1991.
3) Willis, D.W. and Lusk, Bob, On Northern Pond, How Plump is that Fish?
1 Willis, Dave, Lusk, Bob, "On Northern Pond. How Plump is that Fish?
Reprinted with permission from Pond Boss Magazine